Google Analytics lets you track visitors to your store, and generates reports that will help you with your marketing. This article will guide you step-by-step through installation, setup, and use of Google Analytics with RazorCart.
This section will guide you through the configuration of your Google Analytics.
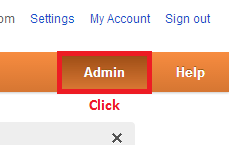
4. On the Analytics Administration page select View Settings. This will take you to the VIEW PROFILE page.
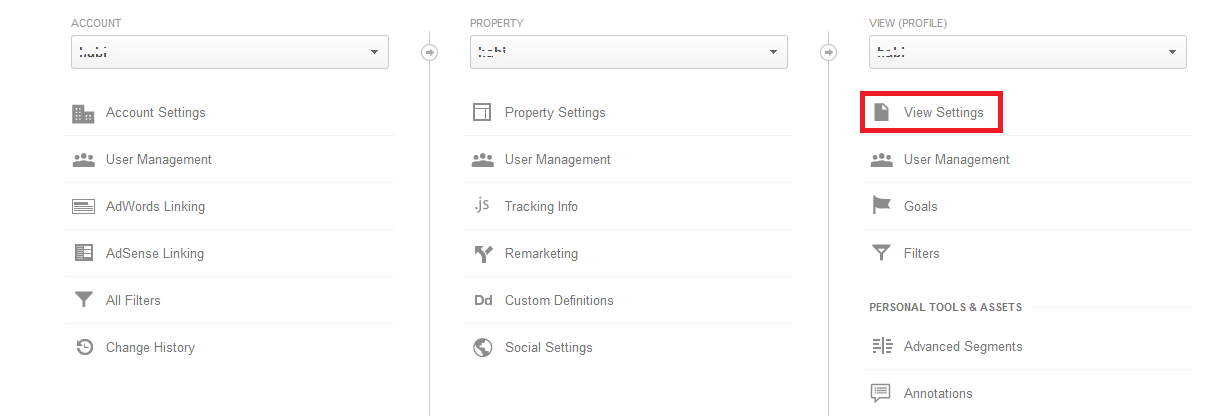
5. On the VIEW (PROFILE) page, in the Ecommerce Settings area, locate the Ecommerce tracking drop down selector. Select ‘Yes, an Ecommerce Site’ and then select the Apply button at the bottom to save your changes.
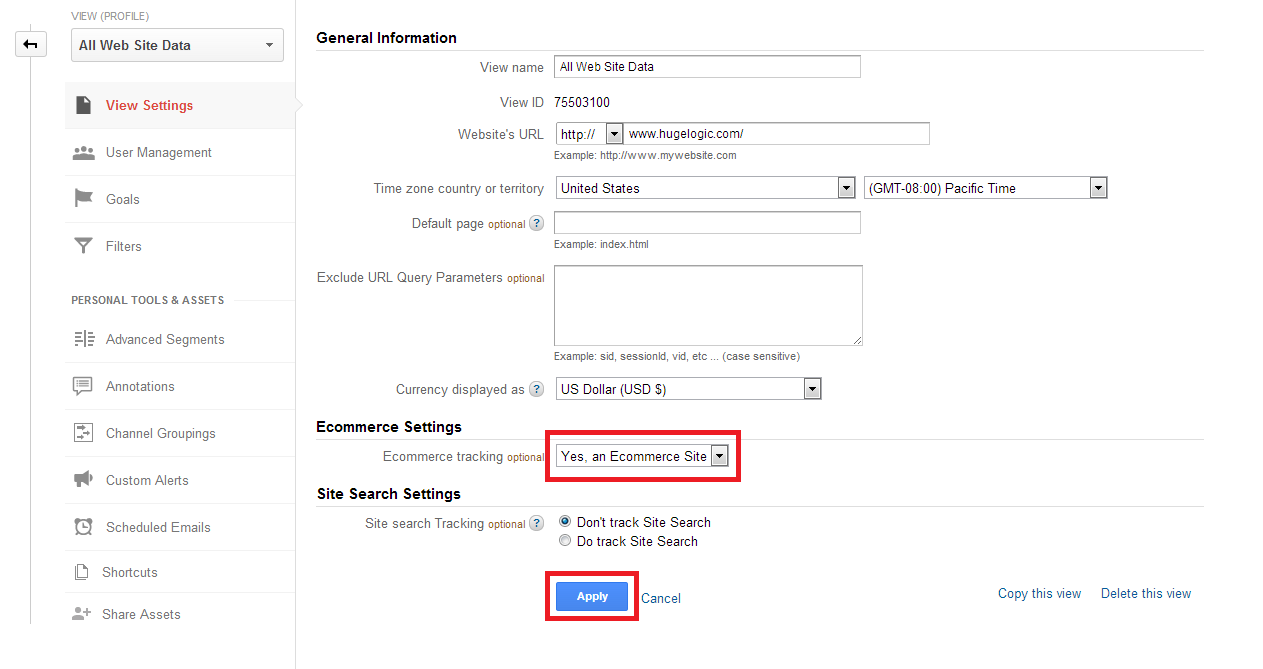
You have now enabled Google Ecommerce Tracking on your Google Analytics account.
Important
Google can take 24 hours to display Ecommerce Tracking data in the Ecommerce reports. You can view your Ecommerce tracking data the day after you set your Ecommerce account up.
Copy Your Google Analytics ID
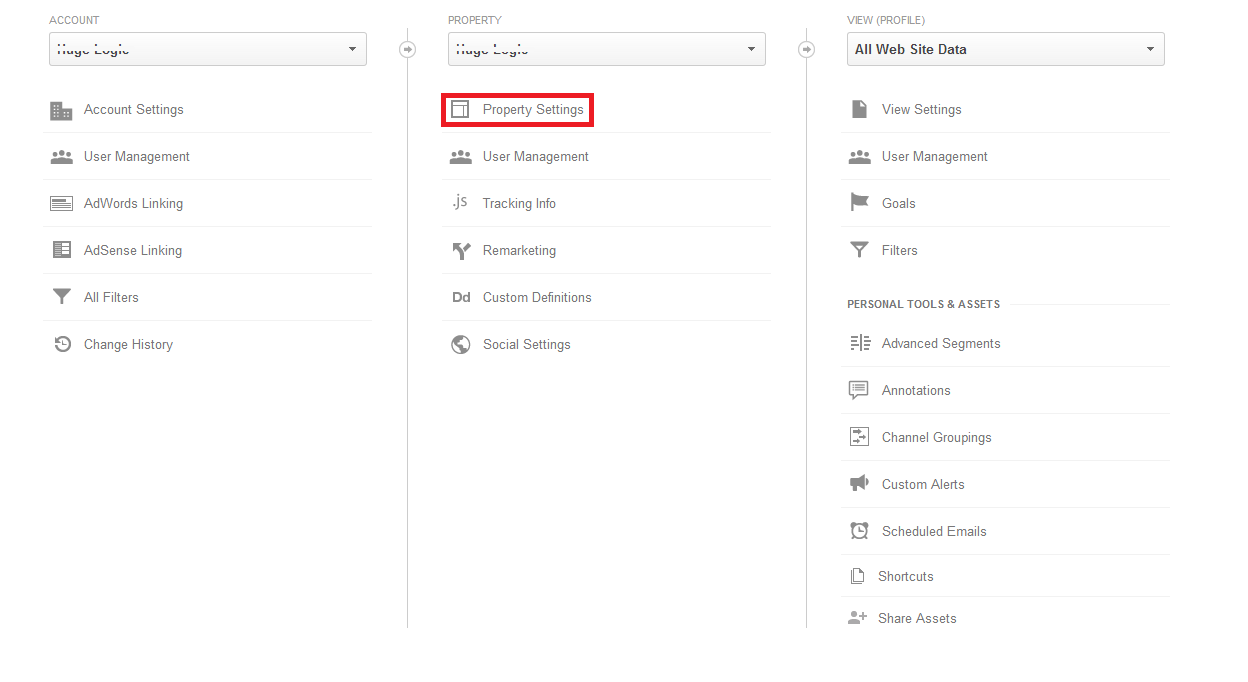
For the next part of this walkthrough you will need your Google Analytics Tracking ID UA number. It looks like this UA-XXXXX-YY and can be found after you log into your Google Analytics account.
- On the Analytics Administration page select Property Settings. This will take you to the Property page.
- On the PROPERTY page locate the Tracking ID
Configuring RazorCart to Use Google Analytics
Now that your Google account is correctly configured to use Analytics, you must link your account with your RazorCart.
Load the RazorCart admin console and navigate to the store settings page, expand the "analytics tracking" panel and enter your Google Analytics Tracking ID UA
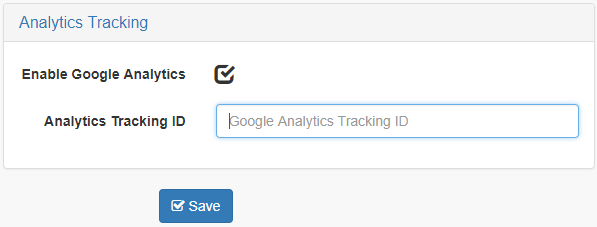
Click "Save" to save your changes.
That’s it. Your Google Ecommerce Tracking is set up and tracking data. You can review your results tomorrow from your Google Analytics account (Google delays data for 24 hours).
Reading Your Data within Your Google Account
- To view Google Ecommerce transactions from your website, first login to Google Analytics and then select Reporting.

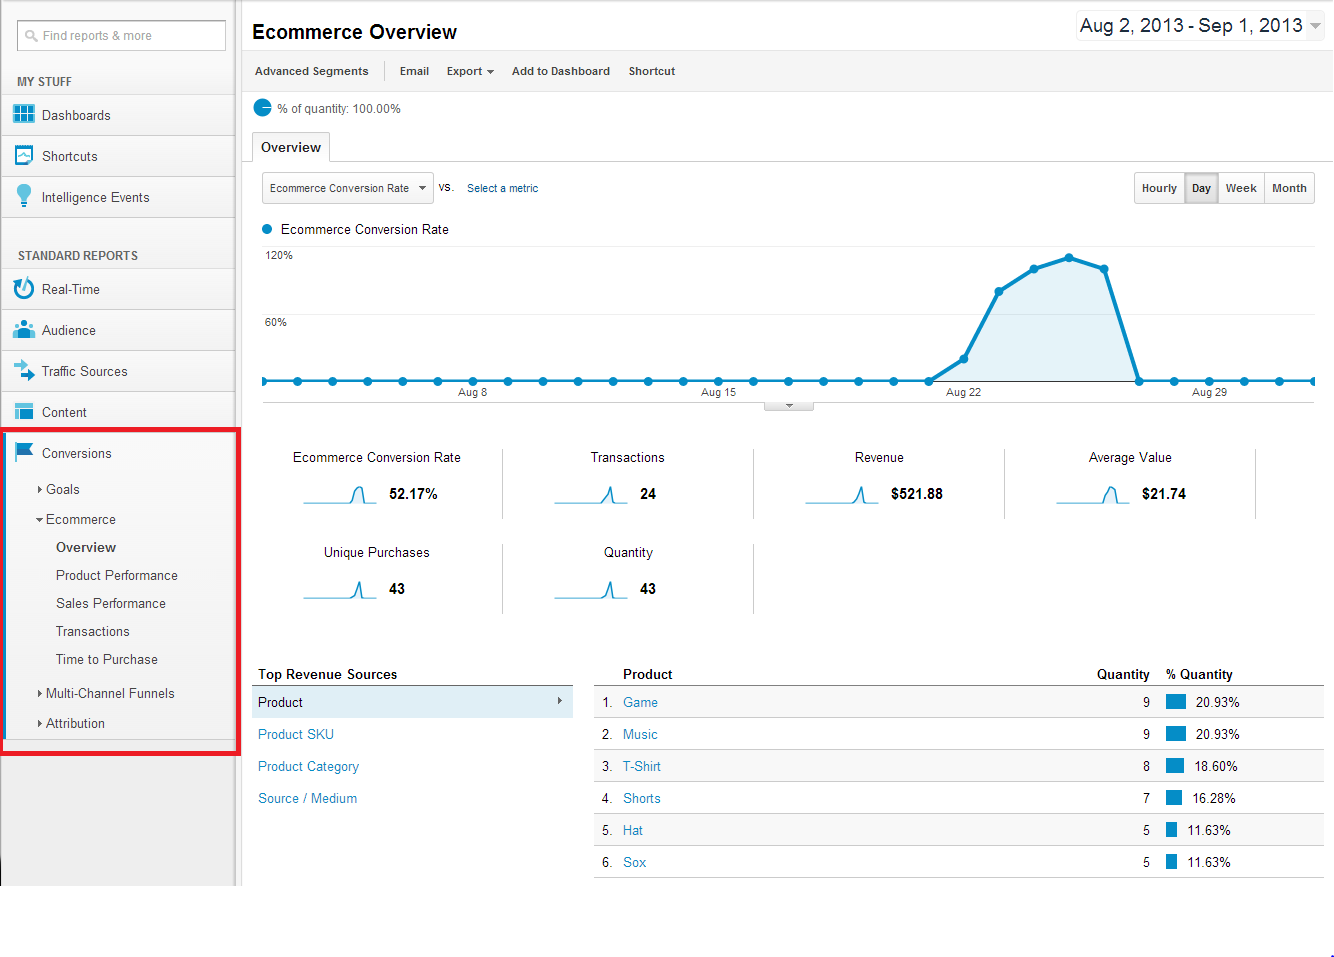
- From the Reporting page, select Conversions and then Ecommerce to view the various Ecommerce reports. The Ecommerce Overview report is shown below.
Step 1 - Create a Goal
From your Google Analytics Admin panel, go to the Goals section under the third column "View". If you have multiple web sites make sure you select the correct site in the properties dropdown.
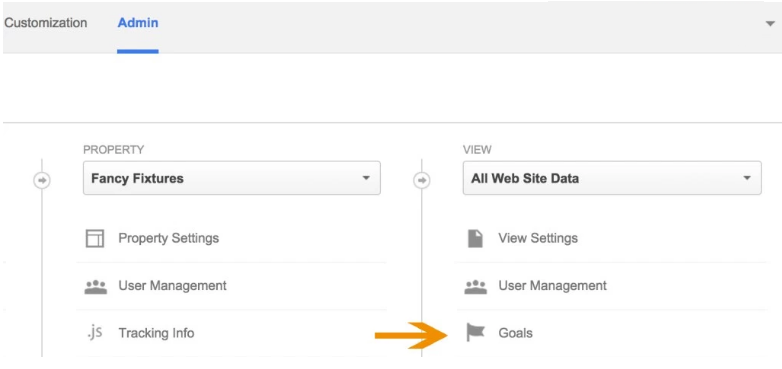
On clicking through, you’ll be taken to the ‘Goal’ page where you can create a new goal.
Step 2 - Goal Setup
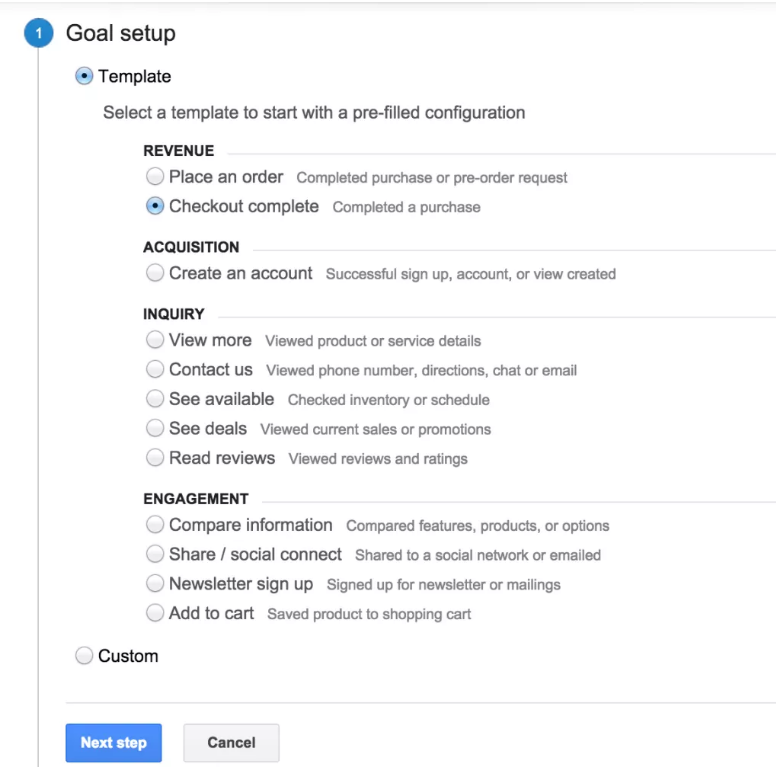
Click the red ‘Create Goal’ button to create a new goal. Next, select a template that defines what kind of goal you want to track. For completed sales, you want to select the ‘Checkout complete’ under the ‘Revenue’ section.
Step 3 - Describe the Goal
Now, you need to describe your goal and define the type of event you want to track. Give it a descriptive name to help you identify the goal in your reports. Then, choose the destination option because you want to track if customers reach your success or thank you page.
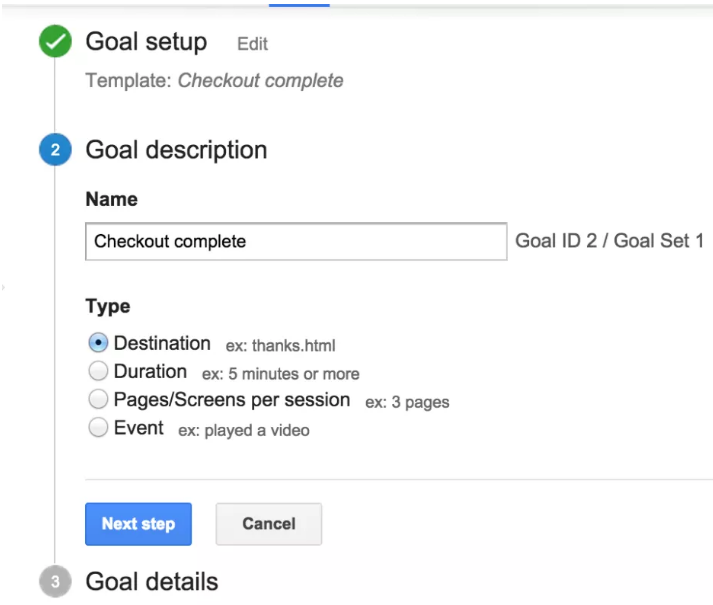
Step 4 - Define the Success URL
For Google Analytics to track if a customer has made a purchase it needs to know what the success page is. This is typically the page a customer sees after making a purchase. If you don’t know what your success URL is, go thru the RazorCart checkout and complete a test purchase. Cut and paste the URL into Google Analytics and select the ‘Equals to’ option.
The following are the RazorCart URL's. Please note, you will need to change the domain name to your domain name.
Cart Page - https://www.yourdomain.com/checkout?Display=cart
Confirm Page - https://www.yourdomain.com/checkout?Display=review
Success Page - https://www.yourdomain.com/checkout?Display=status
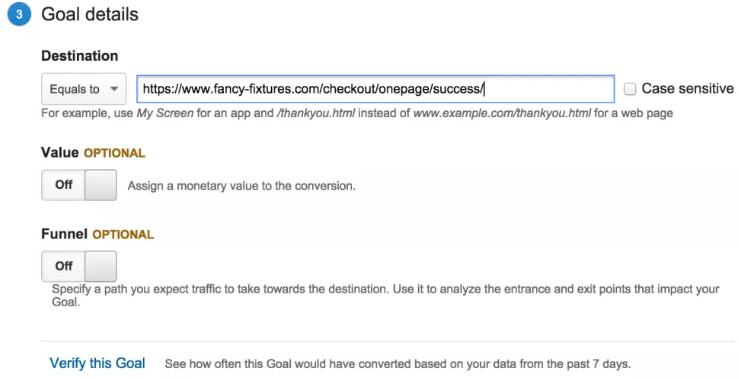
Step 5 - Create the Funnel
The funnel is the path customers take to conversion or purchase. Toggle the funnel to "On". Next, enter every URL that the customer passes through before successfully completing a purchase.
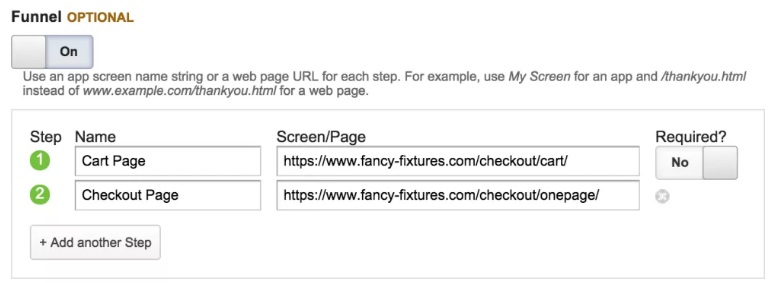
After creating the funnel, save the goal. Google Analytics is now tracking and you can see the results in your reports.
Viewing Funnel Reports
In the Reporting tab, go to the Conversions section and look at the funnel visualization for your Goal. Be sure to select which goal you’re looking at from the drop down.
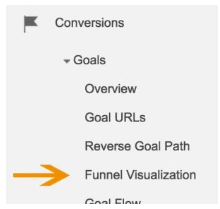
Here Google Analytics shows you your funnel. Look at which steps in the checkout process shoppers are abandoning their carts and when they complete a purchase.
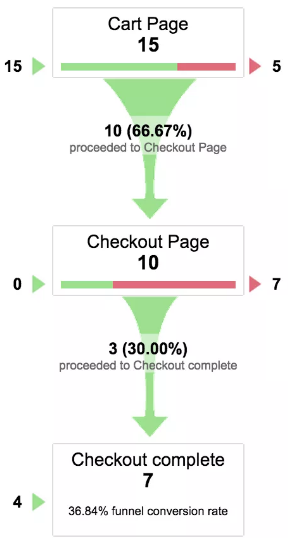
In the funnel report above, you can see that out of 15 shoppers, 5 are dropping out at the cart page, which is 33% of the users are abandoning their carts before the checkout page. The exit column shows which pages they navigate to from the cart page.